
Market Share of Mobile vs Non-Mobile Payments in China
The way Chinese consumers make payments has changed drastically over the last decade.
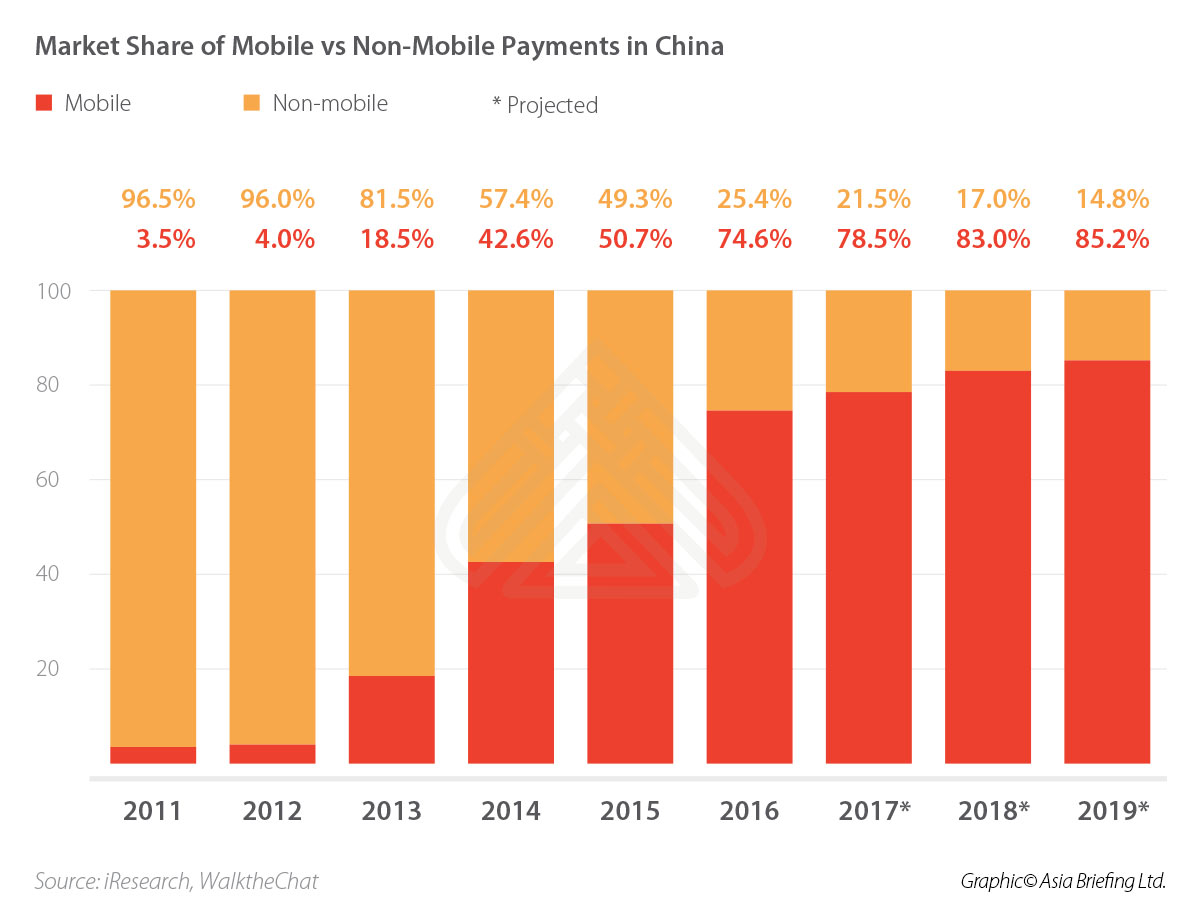
In 2012, 96 percent of payments were still made in cash. Fast forward to 2018, 85.2 percent of payments are made via mobile payment modes.
The Chinese market is evolving in a unique manner from other western countries. To put this into perspective, in 2016, mobile payments in China reached US$8.6 trillion – compared to only US$63 billion in the US.
For more information on mobile payments in China, click here.
To speak to our experts about why your business should adopt a strategy to include mobile payments, contact us.

We provide expert advisory and corporate services across Asia, guiding businesses through complex markets and regulations.